

 购买普通授权版(
 试用
试用
 赞赏(0)
赞赏(0)
更新记录
1.0.7(2026-05-14)
完善了readme.md的使用方式
1.0.6(2026-04-17)
让插件更稳定
1.0.5(2025-08-02)
优化
查看更多平台兼容性
uni-app(4.07)
| Vue2 | Vue3 | Chrome | Safari | app-vue | app-nvue | Android | iOS | 鸿蒙 |
|---|---|---|---|---|---|---|---|---|
| - | √ | √ | √ | √ | - | √ | - | - |
| 微信小程序 | 支付宝小程序 | 抖音小程序 | 百度小程序 | 快手小程序 | 京东小程序 | 鸿蒙元服务 | QQ小程序 | 飞书小程序 | 小红书小程序 | 快应用-华为 | 快应用-联盟 |
|---|---|---|---|---|---|---|---|---|---|---|---|
| √ | - | - | - | - | - | - | - | - | - | - | - |
uni-app x(4.07)
| Chrome | Safari | Android | iOS | 鸿蒙 | 微信小程序 |
|---|---|---|---|---|---|
| - | - | - | - | - | - |
其他
| 多语言 | 暗黑模式 | 宽屏模式 |
|---|---|---|
| × | × | √ |
qiao-renderjs-echarts
简介
基于renderjs开发的echarts插件,支持echarts的所有图表,包括3D图表
市场上有一些基于renderjs开发的echarts的插件,但是都难免有些问题,比如echarts的 function 配置项丢失不生效报错之类的, 这款插件是结合市场插件修复了很多问题后产生的,支持渲染echarts的所有图表,包括3D图表
运行平台
- 支持:App(Vue 页面)、H5
- 不支持:小程序等无 renderjs 的环境(组件内已做条件编译,非上述环境会提示不支持)
使用方法
0、组件如何引入(任选其一,避免「Failed to resolve component: qiao-renderjs-echarts」)
uni-app 默认会按 easycom 扫描 uni_modules 下的组件,但与本插件目录名 qiao-renderjsEcharts(连字符 + 驼峰混用)在某些工程/版本下可能出现自动注册名与文档标签不一致。若控制台出现无法解析组件,请优先使用下面 方式 B 或 方式 C。
方式 A:依赖 easycom 自动引入(无额外代码)
- 保持
pages.json中 未关闭 easycom 自动扫描(一般默认即开启;若自行配置了easycom,请保留"autoscan": true,或未显式写autoscan: false)。 - 在页面中直接使用标签(见下文示例)。
方式 B:页面内手动引入(推荐,最稳妥)
<script setup>(Vue3):在脚本顶部增加一行import,导入的 SFC 会自动当作组件使用,无需再写components选项。
import QiaoRenderjsEcharts from '@/uni_modules/qiao-renderjsEcharts/components/qiao-renderjsEcharts/qiao-renderjsEcharts.vue'- 选项式 API:在
components中注册后再在模板里写同名标签,例如:
import QiaoRenderjsEcharts from '@/uni_modules/qiao-renderjsEcharts/components/qiao-renderjsEcharts/qiao-renderjsEcharts.vue'
export default {
  components: { QiaoRenderjsEcharts }
}模板中仍可使用:<qiao-renderjs-echarts />(Vue 会将 PascalCase 组件与 kebab-case 标签对应)。
方式 C:在 pages.json 中为标签名写死 easycom 规则
在 pages.json 根节点与 pages 同级增加或合并 easycom(路径按你项目别名习惯,与方式 B 指向同一 .vue 文件即可):
"easycom": {
  "autoscan": true,
  "custom": {
    "^qiao-renderjs-echarts$": "@/uni_modules/qiao-renderjsEcharts/components/qiao-renderjsEcharts/qiao-renderjsEcharts.vue"
  }
}
修改后请重新编译运行。
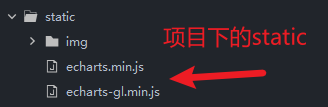
1、准备工作,项目根目录的static文件夹一定先放上echarts的两个相关js,插件会用到,下载后,自己创建文件复制进去吧
<!-- 示例:Vue3 语法糖;请务必保留下一行 import,否则易出现 Failed to resolve component -->
<script lang="ts" setup>
    import { ref } from 'vue'
    import QiaoRenderjsEcharts from '@/uni_modules/qiao-renderjsEcharts/components/qiao-renderjsEcharts/qiao-renderjsEcharts.vue'

    const refCharts = ref()

    const option = ref({
        animation: false,
        grid: {
            top: 0,
            left: 10,
            right: 0,
            bottom: 5,
            containLabel: true
        },
        tooltip: {
            show: false
        },
        legend: {
            show: false
        },
        xAxis: [
            {
                id: 'xAxis1',
                type: 'category',
                data: [],
                axisLine: {
                    show: false
                },
                axisTick: {
                    show: false
                },
                splitLine: {
                    show: true,
                    lineStyle: {
                        color: 'rgba(255, 244, 215,0.3)'
                    }
                },
                axisLabel: {
                    fontSize: 14,
                    color: '#FFFFFF',
                    showMinLabel: false,
                    showMaxLabel: false,
                }
            }
        ],
        yAxis: [
            {
                id: 'yAxis1',
                type: 'value',
                splitNumber: 10,
                minInterval: 0.01,
                boundaryGap: ['1%', '1%'],
                splitLine: {
                    show: true,
                    lineStyle: {
                        color: 'rgba(255, 244, 215,0.3)'
                    }
                },
                axisLabel: {
                    width: 35,
                    overflow: 'truncate',
                    ellipsis: '',
                    fontSize: 14,
                    color: '#FFFFFF',
                    showMinLabel: false,
                    showMaxLabel: false,
                    hideOverlap: true,
                    formatter: function (value) {
                        return Math.abs(value);
                    }
                },
                splitArea: {
                    show: true,
                    areaStyle: {
                        color: ['#000000'],
                    },
                },
            }
        ],
        series: [
            {
                id: 'series1',
                name: '数值',
                type: 'line',
                smooth: true,
                data: [],
                showSymbol: false,
                symbol: 'none',
                smoothMonotone: 'x',
                sampling: 'lttb',
                lineStyle: {
                    color: '#edff1e',
                    width: 1
                }
            },
        ],
        dataZoom: [
            {
                type: 'inside',
                orient: 'vertical',
                filterMode: 'empty',
                throttle: 0,
                preventDefaultMouseMove: false,
            },
            {
                type: 'inside',
                orient: 'horizontal',
                filterMode: 'empty',
                throttle: 0,
                preventDefaultMouseMove: false,
            }
        ]
    })

    const show = (xData : any, yData : any) => {
        // 动态赋值数据
        option.value.xAxis[0].data = [1,2,3,4,5]
        option.value.series[0].data = [10,15,8,20,15]
    }
    defineExpose({
        show
    })
</script>

<template>
    <qiao-renderjs-echarts ref="refCharts" :option="option" :borderWarning="true"></qiao-renderjs-echarts>
</template>
常见问题
| 现象 | 处理 |
|---|---|
Failed to resolve component: qiao-renderjs-echarts |
按上文 方式 B 在页面中增加 import,或按 方式 C 配置 easycom.custom;改完后重新编译。 |
构建报错找不到 ~/utils |
本组件内部引用了 ~/utils 的 set_data。请在工程构建配置中为 ~ 配置路径别名,并提供包含 set_data 的工具模块,或与插件作者提供的示例工程保持一致。 |
注意事项
如果option里边需要用到echarts的实例,需要加 window.echarts 例如:window.echarts.graphic.clipRectByRect({})
参数介绍
option: { //echarts的配置项
    type: Object,
    default () {
        return {}
    }
},
borderWarning: { //滑到边缘是否显示提醒边框,默认隐藏
    type: Boolean,
    default: false,
},

 下载 1794
 赞赏 15
赞赏 15

 下载 12341699
 赞赏 1924


 赞赏
赞赏
 京公网安备:11010802035340号