更新记录
v1.0.0(2021-12-17)
下载此版本
uniapp_使用echarts
平台兼容性
uni-app
| Vue2 |
Vue3 |
Chrome |
Safari |
app-vue |
app-nvue |
Android |
iOS |
鸿蒙 |
| √ |
- |
√ |
√ |
√ |
√ |
- |
- |
- |
| 微信小程序 |
支付宝小程序 |
抖音小程序 |
百度小程序 |
快手小程序 |
京东小程序 |
鸿蒙元服务 |
QQ小程序 |
飞书小程序 |
小红书小程序 |
快应用-华为 |
快应用-联盟 |
| - |
- |
- |
- |
- |
- |
- |
- |
- |
- |
√ |
√ |
其他
uniapp_使用echarts
从 npm 获取echarts
npm install echarts --save
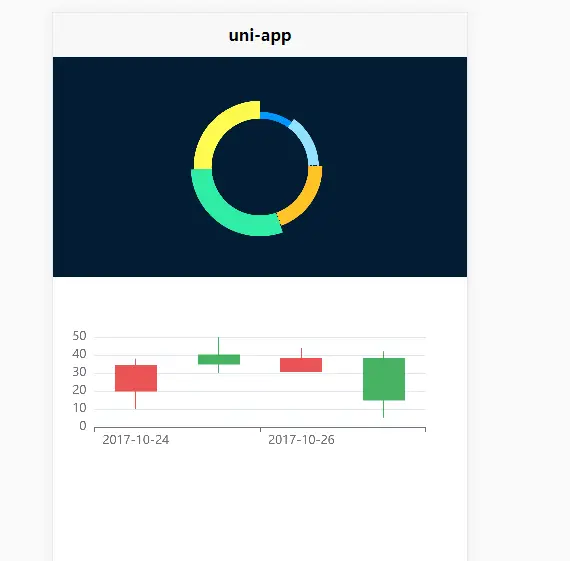
页面使用:(里面index.vue页面有示例)
引入:
<template>
    <view class="content">
        <view style="width: 750rpx;">
            <yh-echarts @myChart="myChartData" :option="optionData1" style="height: 400rpx;"></yh-echarts>
        </view>

        <!-- 如果用两个可以去掉@myChart 传一个实例就可以了 -->
        <view style="width: 750rpx;">
            <yh-echarts :option="optionData2" style="height: 400rpx;"></yh-echarts>
        </view>
    </view>
</template>

<script>
    import yhEcharts from '../../components/yanghao-echarts/yanghao-echarts.vue'
    import * as echarts from 'echarts';
    // 获取组件传过来的 myChart实例
    let myChart = []
    export default {
        components: {
            yhEcharts
        },
        data() {
            return {
                optionData1: '',
                optionData1: '',
            }
        },
        onLoad() {
            this.getoption();
        },
        methods: {
            // 获取传过来的myChart实例
            myChartData(param) {
                myChart = param
            },
            getoption() {
                let newOption1 = {
                    backgroundColor: "#031d33",
                    color: ["#0097FB",
                        "#92E1FF",
                        "#FFC227",
                        "#30ECA6",
                        "#FDFA4E",
                        "#FF4848"
                    ],
                    series: [{
                        name: "标签使用频率",
                        type: "pie",
                     radius: ["44%", "63%"],
                        center: ["50%", "50%"],
                        roseType: "radius",
                        label: {
                            show: false
                        },
                        emphasis: {
                            label: {
                                show: false
                            }
                        },
                        itemStyle: {
                            shadowBlur: 1,
                            shadowColor: 2,
                            shadowOffsetX: 5,
                            shadowOffsetY: 5
                        },
                        data: [21, 32, 43, 64, 55]
                    }]

                };
                let newOption2 = {
                  xAxis: {
                    data: ['2017-10-24', '2017-10-25', '2017-10-26', '2017-10-27']
                  },
                  yAxis: {},
                  series: [
                    {
                      type: 'candlestick',
                      data: [
                        [20, 34, 10, 38],
                        [40, 35, 30, 50],
                        [31, 38, 33, 44],
                        [38, 15, 5, 42]
                      ]
                    }
                  ]
                };
                this.optionData1 = newOption1
                this.optionData2 = newOption2

            }
        }
    }
</script>


 收藏人数:
收藏人数:
 https://gitee.com/suixinxingyanghao/uniapp-echarts
 下载插件并导入HBuilderX
 下载示例项目ZIP
 赞赏(0)
赞赏(0)

 下载 1031
 赞赏 0
赞赏 0

 下载 11288454
 赞赏 1861


 赞赏
赞赏

 京公网安备:11010802035340号