


 下载插件并导入HBuilderX
 下载示例项目ZIP
 赞赏(1)
赞赏(1)
更新记录
1.0.0(2022-11-05) 下载此版本
vue3-echarts 支持H5、小程序
平台兼容性
uni-app
| Vue2 | Vue3 | Chrome | Safari | app-vue | app-nvue | Android | iOS | 鸿蒙 |
|---|---|---|---|---|---|---|---|---|
| × | √ | √ | √ | √ | √ | - | - | - |
| 微信小程序 | 支付宝小程序 | 抖音小程序 | 百度小程序 | 快手小程序 | 京东小程序 | 鸿蒙元服务 | QQ小程序 | 飞书小程序 | 小红书小程序 | 快应用-华为 | 快应用-联盟 |
|---|---|---|---|---|---|---|---|---|---|---|---|
| √ | √ | √ | √ | √ | √ | - | √ | √ | - | - | - |
其他
| 多语言 | 暗黑模式 | 宽屏模式 |
|---|---|---|
| × | × | √ |
vue3-echarts
vue3-echarts 使用方式与代码
<template>
<view class="content">
<vue3-echarts class="echart" ref="echarts" :options="options" canvasId="echarts" @click="handelChart"></vue3-echarts>
<view class="btns">
<button type="primary" size="mini" @click="saveImg">导出图片</button>
</view>
</view>
</template>
<script setup>
import { ref, reactive, onMounted } from 'vue';
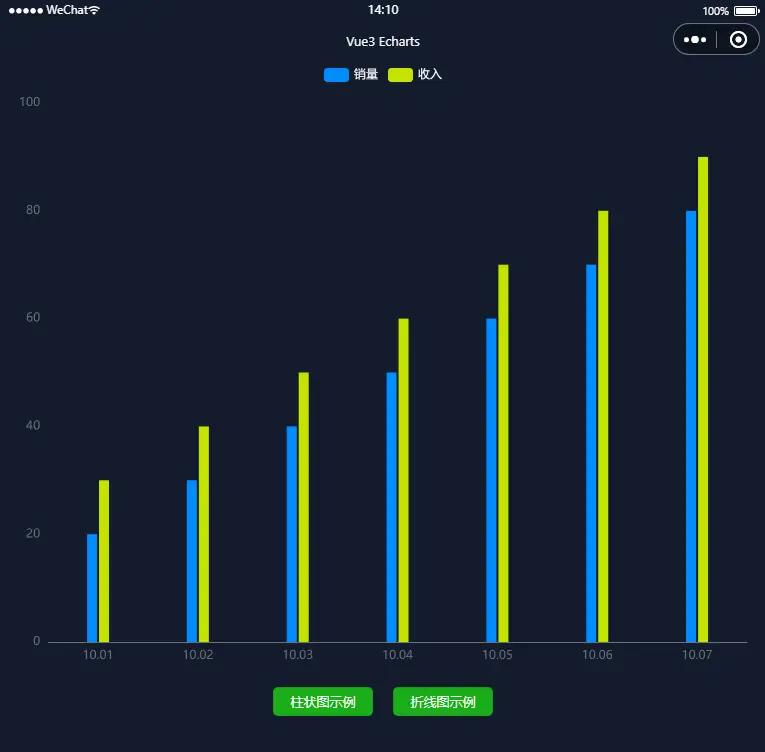
const options = reactive({
tooltip: {
trigger: 'axis',
axisPointer: {
// 坐标轴指示器,坐标轴触发有效
type: 'shadow' // 默认为直线,可选为:'line' | 'shadow'
},
confine: true
},
legend: {
data: ['销量','收入']
},
grid: {
left: 20,
right: 20,
bottom: 15,
top: 40,
containLabel: true
},
xAxis: {
type: 'category',
data: ['Mon', 'Tue', 'Wed', 'Thu', 'Fri', 'Sat', 'Sun']
},
yAxis: {
type: 'value'
},
series: [
{
name:'销量',
data: [20, 30, 40, 50, 60, 70, 80],
type: 'bar',
showBackground: true,
},
{
name:'收入',
data: [30, 40, 50, 60, 70, 80, 90],
type: 'bar',
showBackground: true,
}
]
});
const echarts = ref(null);
const saveImg = ()=>{
echarts.value.canvasToTempFilePath({
success: (res) => {
// #ifdef H5
console.log(res.tempFilePath)
return;
// #endif
// 存入系统相册
uni.saveImageToPhotosAlbum({
filePath: res.tempFilePath || '',
success: res => {
console.log("success", res)
},
fail: res => {
console.log("fail", res)
}
})
},
fail: (res) => console.log(res)
});
};
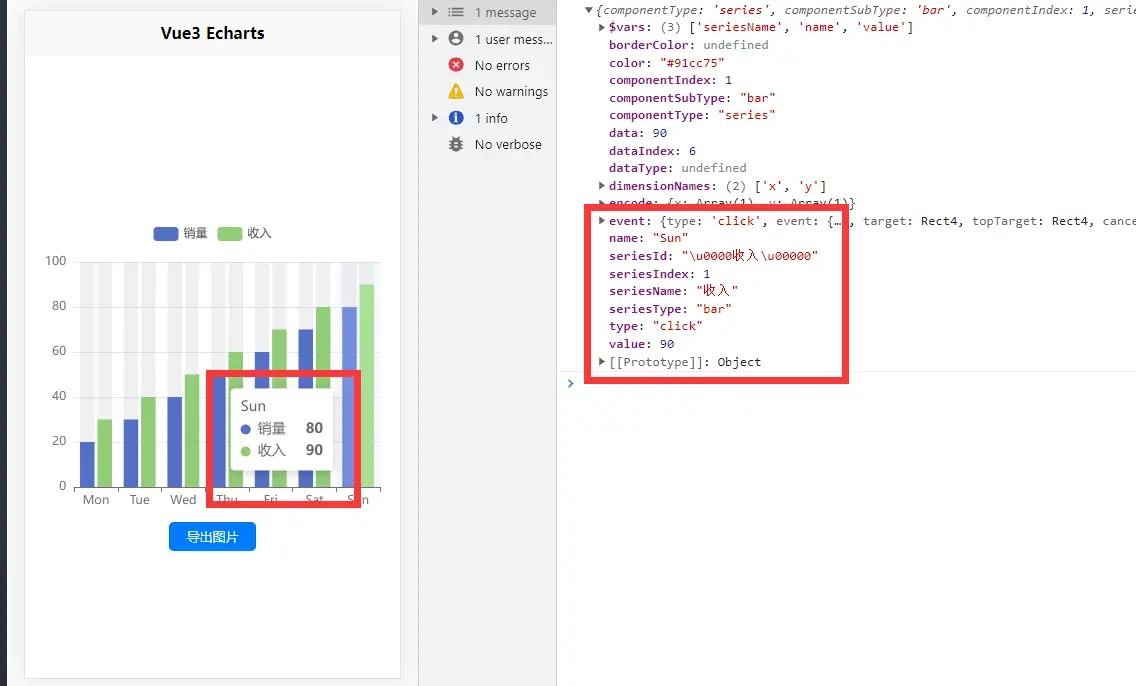
// chart 点击回调函数
const handelChart = val=>{
console.log(val)
}
</script>
<style>
.content {
display: flex;
flex-direction: column;
align-items: center;
justify-content: center;
height: 100vh;
}
.echart{
width: 100%;
height: 600upx;
}
</style>ECharts 配置与官网一中,使用修改上面 options 的内容,实时更改变图表。options 的使用方法参见 ECharts 配置项文档。对于不熟悉 ECharts 的用户,可以参见 [5 分钟上手 ECharts](https://echarts.apache.org/tutorial.html#5 分钟上手 ECharts) 教程,官网参考示例。
点击回调函数
组件中绑定 @click="handelChart"事件。
<vue3-echarts class="echart" ref="echarts" :options="options" canvasId="echarts" @click="handelChart"></vue3-echarts>

// 回调函数
const handelChart = val=>{
    console.log(val)
}

 下载 2259
 赞赏 1
赞赏 1

 下载 12399679
 赞赏 1930


 赞赏
赞赏 京公网安备:11010802035340号